|
<< Click to Display Table of Contents >> Standard Report Wizard |
  
|
|
<< Click to Display Table of Contents >> Standard Report Wizard |
|
The Standard Report Wizard guides you through the creation of a standard report. As discussed earlier, a standard report is one that does not print labels or have a Cross-Tab on the primary section.
Report Wizards are simply tabbed dialogs that allow you to specify the different attributes of the report. The tabs across the top of the dialog represent the different attributes of the report that you can specify. You select a tab by clicking the tab with the left mouse button or by pressing the Next>> and <<Back buttons until the desired tab is selected.
In general, you should specify report options from the left most tab working toward the right most tab.
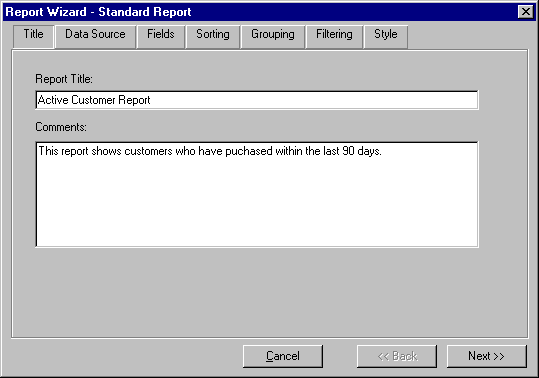
Title Tab
This tab allows you to specify a report title and store comments about the report you are creating. The title appears in the caption of the report work window making it easier to identify the report you are working on. The title is for readability only and is not used by ReportPro.
The Comments edit is where you can enter a brief description of the report. This is useful for recording details about how the report was implemented or the intent of the report. Again, this information is not used by ReportPro and is provided for your convenience.
Data Source Tab
This tab is where you specify what data will be available to the report.
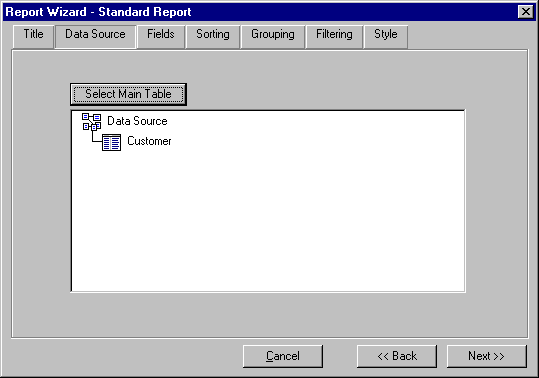
When you first select the Data Source tab, the list box in the middle of the dialog is empty. To specify the primary table or query, click the Select Main Table button. ReportPro will present a series of dialogs prompting you to specify a database driver and primary table. This process is the same as you encounter when manually creating a report and is covered in detail in the chapter entitled "Creating a Report".
After you have identified a primary table or query, the list box will be updated to reflect your selection. You can add tables and queries to the data source via pop-up menus that are activated by clicking the right mouse button on objects in the list box. Refer to the chapters entitled "Configuring Local Tables" and "Configuring SQL Queries" for a detailed description of each menu option.
Fields Tab
The next step is to specify the fields you wish to include on the report.
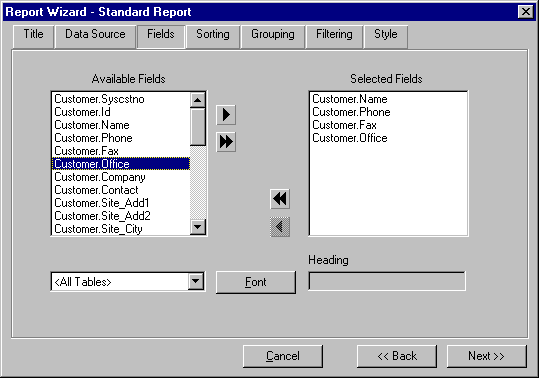
On the Fields tab, the Available Fields list box displays the fields that are available from the data source you specified on the Data Source tab. You specify which fields to include on the report, by adding them into the Selected Fields list box.
There are several ways to add fields into the Selected Fields list box. The single right arrow > moves the highlighted field from the Available Fields list box into the Selected Fields list box. The double right arrow >> copies all fields from the Available Fields list box into the Selected Fields list box.
If you mistakenly add a field into the Selected Fields list box, you can remove it by highlighting it and pressing the single left arrow <. You can remove all fields by clicking the double left arrows <<. You can also move fields between list boxes by double-clicking them with the left mouse button.
The order of the fields in the Selected Fields list box can be changed by clicking the left mouse button over the desired field and while holding the mouse button down moving the field to the preferred position in the list box.
The Tables list box allows you to limit the fields displayed in the Available Fields list box to those of a single table. This feature is very useful when you are creating a report that uses more than one table. To specify a table filter, click on the down arrow on the list box and choose the desired table. If you wish to see the fields for all tables select the <All Tables> entry.
Pressing the Font button displays a dialog to allow you to select a font for all field and text objects that will be created for the report. If you wish to specify a font for a single field, you'll have to do that later in the work window.
The Heading edit allows you to specify a heading or title for each field. Headings are used in listing and form based reports to identify the field. If you choose to create a listing style report, the heading will be placed in the Page Header band directly above the field. If you choose a form style report the heading will appear to the left of the field.
Headings default to the field name but you may wish to specify a more readable name. To specify a heading, click the desired field in the Selected Fields list box with the left mouse button and type in the new heading in the Heading edit.
Sorting Tab
The Sorting tab allows you to specify how data from the data source will be sorted. The Sorting tab works very much like the Fields tab. You select fields from the Available Fields list box and copy them to the Sorted By list box.
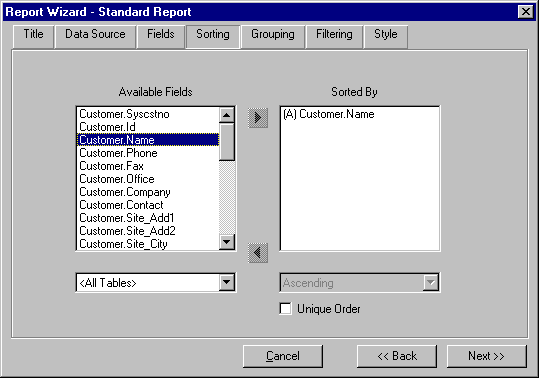
ReportPro supports sorting on multiple fields. The first field you select identifies the primary sort order. Each additional field you specify defines a sub-sort of the previous field(s). For example, if your data source consisted of a sales table and you selected the fields SALESMAN and DATE, ReportPro would sort the invoices first by salesman and then sub-sort the invoices in date order for each of the salesman.
You can specify a Ascending or Descending sort for each of the fields in the Sorted By list box. To do so, highlight the desired field by clicking it once with the left mouse button and then select the desired sorting method from the Sort Method list box. You will notice that doing so will display either the letter A or the letter D to the left of the field identifying the chosen sort method.
You can also specify that the sorting process produce only unique values by checking the Unique Order check box. This process eliminates duplicate rows from the data source. For example, if your sales table contained only one salesman and you created unique sort on salesman your report would only print one record.
Grouping Tab
The Grouping tab allows you to specify how data in the report will be grouped. The concept of grouping is covered in detail later in this manual, but in general, when you specify grouping, ReportPro creates additional report bands that print before and after a series of records.
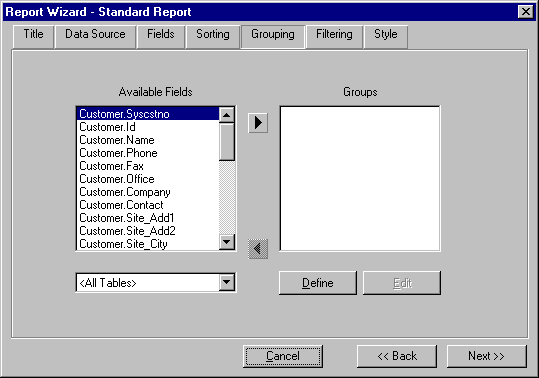
The Grouping tab works similar to the Fields and Sorting tab. You specify groups by copying fields from the Available Fields list box into the Groups list box.
Pressing the Define button will display another dialog where you can define an expression based group by specifying a group name and a grouping expression. You can also edit an existing group by selecting the desired group in the Groups list box and pressing the Edit button.
For more information on how Grouping works please see the chapter on Grouping later in this manual.
Filtering Tab
The Filtering tab allows you to define a filter for the data source. A filter is an expression which restricts the amount of data that is retrieved from the data source. Each record in the data source is tested against the filter expression. If the filter expression returns true that record is added to the report, otherwise it is skipped.
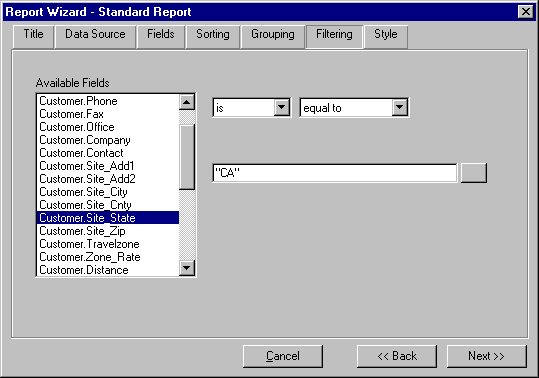
A filter is created by defining filter clauses for one or more fields in the Available Fields list box. If a filter clause is defined for two or more fields, the clauses are combined into a compound expression using a logical AND operator.
To define a filter clause, highlight the desired field in the Available Fields list box, select an operator from the Operator list box and enter the comparison expression in the Expression edit.
The Operator list box contains many different operators to allow you to create sophisticated filtering conditions. Each of the operators is discussed in the table below.
Statement |
Description |
Any Value |
Any value will match. This is considered a state where no filter clause is defined for the selected field. |
Equal To |
Only include records where the field's value exactly matches the value of the expression entered in the Expression edit. For example, "AA" is exactly equal to "AA" but not to "AAA." |
Similar To |
Only include records where the field's value is similar to the value of the expression entered in the Expression edit. For example, "AA" is similar to "AAA" but not exactly equal. |
Less Than |
Only include records where the field's value is less than the value of the expression entered in the Expression edit. Values equal to the expression can also be included by checking the "OR EQUAL TO" check box. |
Greater Than |
Only include records where the field's value is greater than the value of the expression entered in the Expression edit. Values equal to the expression can also be included by checking the "OR EQUAL TO" check box. |
The Negate list box contains an IS NOT option that allows you to negate the result of the comparison operator you specified in the Operators list box. Records will be included in the report if the negated result is true.
If desired, the Expression Builder can be used to build the comparison expression. To display the Expression Builder, click on the button to the right of the Expression edit.
Style Tab
The Style Tab allows you to specify miscellaneous style settings for the report. Here you can specify the field layout style, greenbar simulation, title page, page layout and column/label settings.
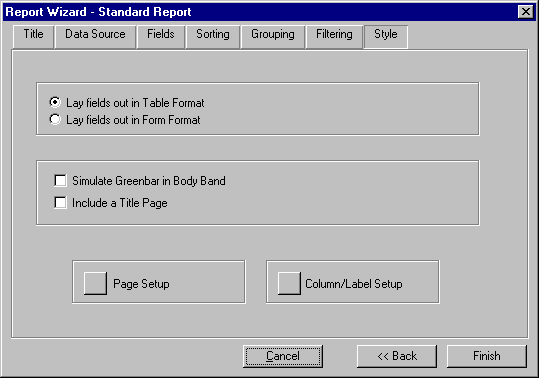
The field layout style can be set to either Table or Form format. If you choose Table format, the database fields will be laid out in a horizontal manner along the top of the Body band. If you select the Form format, the fields will be laid out vertically on the left edge of the Body band.
Greenbar paper has pre-printed horizontal bars evenly spaced down each page. This feature of the paper makes it easy to follow information that is laid out horizontally on a page especially if the paper is greater than 14 inches wide. ReportPro can simulate Greenbar by printing gray bands across the page at regular intervals. This effect looks best on laser printers but is generally unreadable when faxed.
A Title Section can be automatically included in the report by checking the Title Page check box. The Title section prints at the beginning of a report and is useful for creating report cover pages.
Both Page Layout and Column attributes can be specified by clicking the appropriate button at the bottom of the Style tab. Both these options are covered in detail later in this manual.
After you have defined your reporting options press the Finish button and the Report Wizard will open a work window and build a new report based on the options you specified. If the Finish button is disabled, it is because you haven't specified the required information to the Report Wizard. At a minimum you must specify a data source and select at least one field on the Fields tab.