|
<< Click to Display Table of Contents >> Graph Wizard - Columns Tab |
  
|
Graph Wizard - Columns Tab
|
<< Click to Display Table of Contents >> Graph Wizard - Columns Tab |
|
The Columns tab allows you to define the expressions that are used to retrieve information from the data source. You define the graph columns by adding column objects into the hierarchical list shown in the figure below.
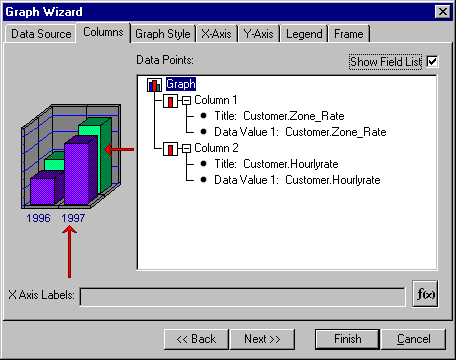
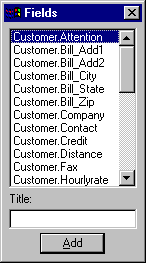
There are two ways to add columns to the graph. If you click the Show Fields List check box, ReportPro will display a dialog that contains a list of all the fields available from the data source. You add columns by selecting the desired field in the field list and pressing the Add button. The Title edit at the bottom of the Fields dialog allows you to specify a title for the selected field.
You can also add columns by clicking the right mouse button over the Graph icon in the Columns tab and selecting Add Column from the pop-up menu. When you select this method, you will be prompted with the Expression Builder where you can specify an expression that is used to retrieve the column data.
Once you have added a column to the graph, you can access options related to it by clicking the right mouse button over the desired column icon. Available options include Insert Column, Delete Column and Add Data Point. You can also click the right mouse button over the column title and data value expressions to edit them.
To define an expression that retrieves the x-axis labels from the data source, click on the ![]() icon and the Expression Builder will be displayed to allow you to specify the desired expression. The information returned by this expression will be printed on the x-axis to identify each of the columns.
icon and the Expression Builder will be displayed to allow you to specify the desired expression. The information returned by this expression will be printed on the x-axis to identify each of the columns.
Also See: