|
<< Click to Display Table of Contents >> Graph Wizard - Y-Axis Tab |
  
|
Graph Wizard - Y-Axis Tab
|
<< Click to Display Table of Contents >> Graph Wizard - Y-Axis Tab |
|
The Y-Axis tab allows you to specify attributes related to the y-axis of the graph.
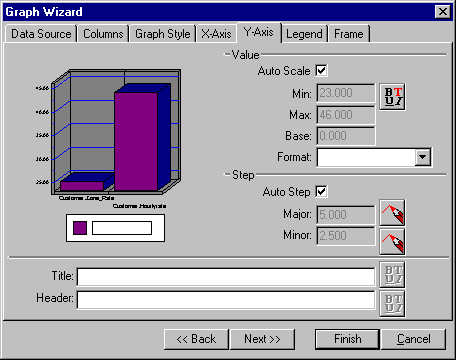
The Value section allows you to control the range of values displayed on the y-axis. The Graph object has an auto scale feature that automatically determines the y-axis scale values. Normally you should leave this option checked. If you wish to manually configure the y-axis range information, uncheck the Auto Scale check box, and the remaining edits in the value section will become enabled.
The Min value edit allows you to specify the minimum value that is displayed on the y-axis. The Max value sets the maximum value displayed. The Base edit sets the value where the columns are drawn from.
The Format combo box allows you to specify a picture clause to format the y-axis values with. The Value font button allows you to specify a font for the y-axis values.
The Step section allows you to control the resolution of the graph grid. The graph displays both major and minor grid lines. These edits allow you to specify the interval at which the grid lines are drawn. These edits are normally disabled, and the Graph object automatically calculates the best grid resolution. If you wish to manually set the grid resolution, you must uncheck the Auto Step check box. The color buttons next to each edit allow you to define the color of the grid lines.
The Title and Header edits allow you to attach descriptive information on the y-axis. The title displays vertically beside the y-axis values while the header displays at the top of the y-axis. Each edit has an associated font button to allow you to identify the font to use for the title and header.
Also See: